Global Night Light Patterns Reveal Economic Shift to the East
The mean centre of world lighting is moving east at the rate of 60
km per year, according to a new analysis of archived satellite images

The amount of light produced by a society is closely correlated with its economic status–rich developed countries tend to be brighter at night than poor developing ones. So an interesting question is how the distribution of light across our planet is changing over time.
Today we get an answer thanks to the work of Nicola Pestalozzi, Peter Cauwels and Didier Sornette at the Swiss Federal Institute of Technology in Zurich. These guys have used data released by the US Defense Meteorological Satellite Program which has monitored night light levels around the planet continuously since the mid-1960s.
Various groups have studied this data to show how changes in night lights provide a useful way of monitoring things like population growth, energy consumption and gross domestic product, particularly in countries where official statistics are hard to come by.
These groups have significantly enhanced the data by processing in various ways such as removing the effects of fires, which burn brightly for short periods of time, and by combining the data for an entre year to produce an annual picture of light production.
Pestalozzi, Cauwels and Sornette look in particular at the dynamics of night lights. They calculate the planet’s mean centre of light and measure how it has moved in the last couple of decades. “Over the past 17 years, [the center of light] has been gradually shifting eastwards over a distance of roughly 1000 km, at a pace of about 60 km per year,” they say.
They’ve also used night lights as a way to monitor all kinds of other changes such as the expansion of developing countries like Brazil and India, the drop in light levels in countries suffering from demographic decline and a reduction in urban population like Russia and the Ukraine, and the success of light pollution abatement programs in countries such as Canada and the United Kingdom.
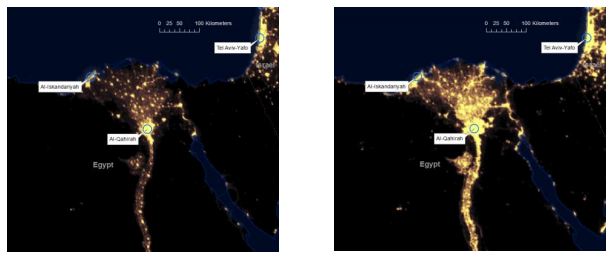
Perhaps their most fascinating insight is in the rapid increase of economic regions such as the Nile Delta (see above) and the area around Shanghai. Pestalozzi, Cauwels and Sornette say that the data clearly shows how light produced by these areas in the developed world has remained remarkably stable, with the New York metropolitan region easily topping the rankings by sheer size.
However, the amount of light produced by these areas in the developing world has increased dramatically with Shenzen in China and the Nile Delta in north Africa showing the biggest increases.
An interesting exception is the region around Milan in Italy which has dramatically increased light production because of agglomeration with the surrounding areas of Monza, Bergamo and Brescia.
Of course, night light dynamics will never replace traditional measures of economic activity but it does provide a global view that is easy to measure and interpret. Interesting stuff!
Ref: arxiv.org/abs/1303.2901: Dynamics and Spatial Distribution of Global Nighttime Lights
No comments:
Post a Comment